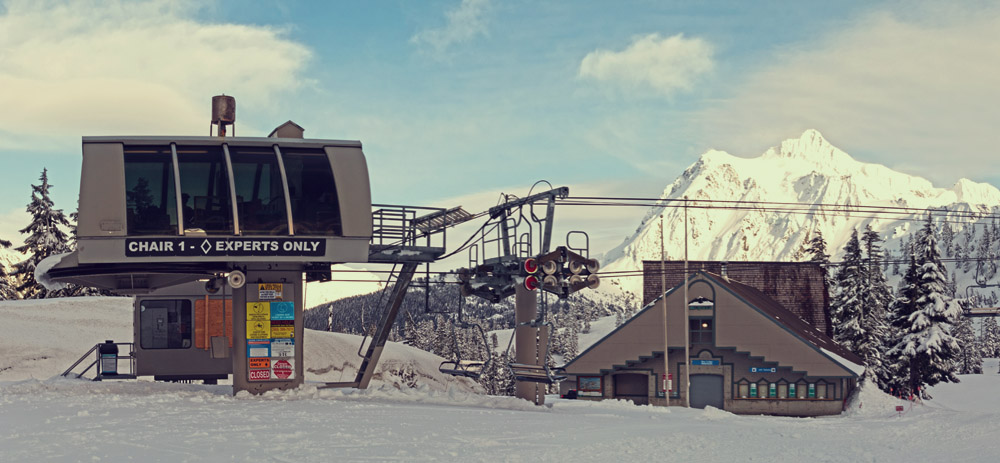
On those rare clear winter days, waiting in the morning lift line for Chair 1 to open at Heather Meadows provides a beautiful view of Mt. Shuksan. Before opening time at 9am it’s common for the lift to start and stop multiple times as the lifties prepare for the day’s operations and ski patrol heads up the mountain to complete avalanche control. Each time the lift starts again the engine revs up providing a guilty reminder that, while other ski areas in the Washington Cascades are electrified, Mt. Baker’s are all powered by burning diesel fuel. The juxtaposition of a frozen Mt. Shuksan looming over the ski area with a diesel engine belching blackened exhaust into the air feels odd at best. Enough so that it made me wonder, what would it take to electrify Mt. Baker? Is it feasible? And should it be done?
Why is this necessary?
First, a disclaimer: I am not an electrical engineer, ski area manager, nor a chairlift mechanic. All of the numbers here are rough, ballpark estimates made from research into approximate figures found from various sources. Sources are cited where needed/available, but please email me if you find an inaccuracy so that it may be corrected.
Why does Baker use diesel to power all of its lifts when other ski areas in Washington use electric? After all, combustion engines are more expensive to operate and less reliable. Well, this is not by choice. It’s because unlike the other ski areas in Washington, Mt. Baker is completely off-grid. So not only are the lifts diesel powered, but also the day lodges, patrol huts, maintenance buildings, and on-site employee housing. The closest power lines are 10 miles away and, as we’ll see in this post, extending those to Baker is quite the expensive endeavor.
There is one caveat to that though: Lift nerds like myself may have noticed that Chair 7 is electric. Indeed, in 2007, the Riblet Chair 7 was replaced with a new electric Skytrac lift. This project included a new diesel generator for powering both the new Chair 7 and all of the White Salmon base area. Supposedly Baker is working on undertaking a similar project for the Raven Hut and chairs 3/4, 5, and 6 by converting their powerplants to electric engines run from a generator as well. Regardless of the actual motor on the chairlift though, every watt of power used at Baker is generated from diesel fuel at some point be it directly from a diesel engine or diesel generator.
But why does this even matter? Given the elevation Baker sits at and having no ability to expand climate change should be of paramount concern for Baker in the coming decades. Contributing to that problem directly by running diesel chairlifts when viable electric options exist would seem counterproductive to the goal of eliminating sources of emissions. More immediately though, programs such as Washington’s cap-and-invest program on emissions will make it more expensive for businesses to emit greenhouse gases (granted, I don’t believe Baker is affected by this particular law because it is below the 25,000 tons emissions limit and sits on federal land within a National Forest, but a not-so-distance future program may apply to Baker). But even if you don’t care about limiting emissions electric engines are more reliable and energy efficient. This means less chairlift downtime and lower operating costs equating to at least marginally slower rising lift tickets prices.
With that in mind, let’s take a look at approximately what Baker’s emissions are, what it would take to electrify it, and if there’s any other practical alternatives.
How much CO2 does Baker emit?
Naturally the first question to ask about all of this is how much CO2 is Baker currently emitting per year? We’ll have to make a few assumptions, but this is something that can be approximated to within a ballpark figure using a few base values. Keep in mind these numbers are all rough estimates. The goal is to get within an order of magnitude to the actual number for the purposes of this analysis and are essentially back of the envelope math.
For simplicity, let’s ignore the electricity requirements of the day lodges and operations buildings and focus on calculating the emissions of a single lift then scale that by seven to account for all of Baker’s lifts (Chair 3 & 4 are one lift and accordingly only have a single engine). Doing so will give an average number that should account for differences between length, vertical rise, load factor, and engine models.
From Liftblog, who cites Doppelmayr’s Worldbook (the lift’s manufacturer), we know that Chair 5 uses a 425 Caterpillar engine.
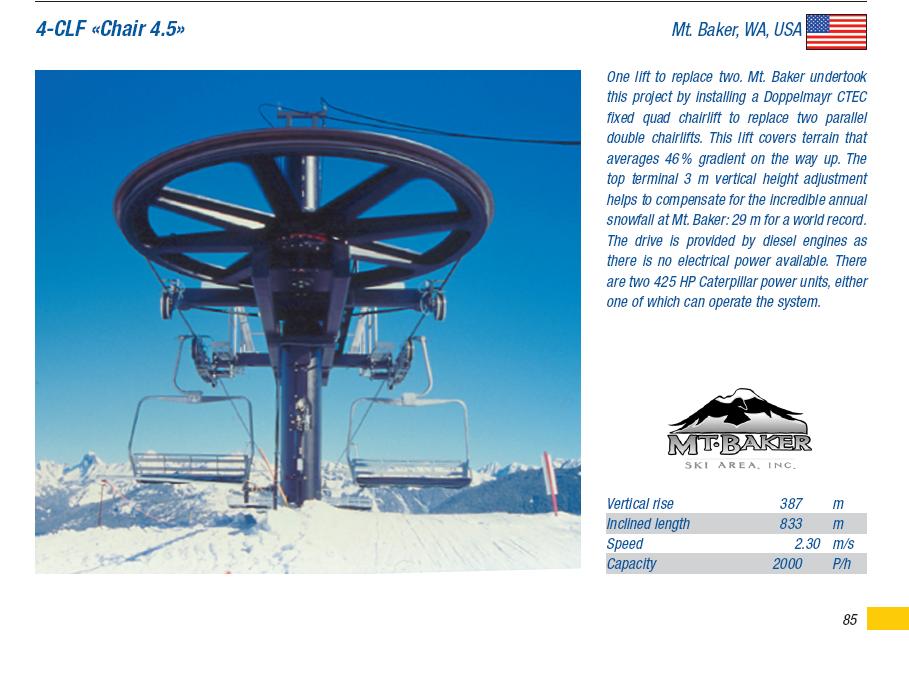
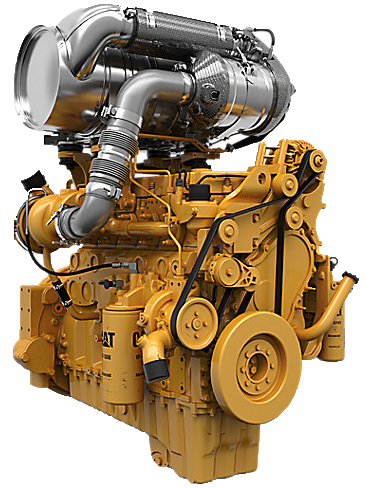
We also know from a 2012 interview with Duncan Howat (the then general manager of Baker) that they use what’s known as a Tier 4 engine. These engines being the most fuel efficient and in turn having the lowest emissions. The closest match I can find for a 425HP, tier 4 engine is the Caterpillar C9.3B engine. At 456HP it’s not a perfect match, but this should be close enough for close enough for our estimation purposes here.
Unfortunately, Caterpillar does not publish fuel consumption or fuel efficiency ratings for their engines, or at least they’re not included on the engine spec sheet. In order to determine the fuel efficiency of an engine we need to know the specific fuel consumption (SFC) of that engine under different loads. In lieu of that graph, we’ll need to make an assumption on that value here. After poking around a handful of research papers, it would seem that a reasonable value for SFC of a diesel engine in the 400HP range is 0.3kg/kWh.12
The next question is what is the load factor on this engine? How hard the engine is being run will directly correspond to how much fuel it consumes and thus how much CO2 it emits. Obviously it’s not being redlined all day long, but it’s difficult to know exactly how hard it is being run so we’ll need to make another assumption here. 425HP is fairly beefy for a fixed grip quad so I believe the load factor would be somewhat low. Let’s say it’s 50% to overestimate.
Now let’s convert the 456HP to kW (since SFC is measured in kg/kWh) and divide by half to account for the 50% load factor. 1HP equals 0.75kW so 456HP * 0.75 * 0.5 = 171kW. From here we can get fuel consumption by multiplying the SFC by the power output which would be 171kW * 0.3kg/kWh = 51.3kg/h. Converting this to imperial units yields 16.1gal/hr given 7lbs per gallon of diesel.
From here, we simply need to multiply by the number of hours per year the lift is running. Baker typically opens late November or early December and closes late April. Let’s assume a good season at 180 days. Hours of operation are 9am - 3.30pm, but let’s call this 8am - 4pm since there are opening/closing tasks that employees use the chairlifts for outside of operating hours. That gives us 8hrs/day * 180 days * 16.1gal/hr = 23,184gal/season. And let’s multiply that by seven for each chairlift (again, Chair 3 & 4 are one lift) to get 162,288gal/season.
When burned one gallon of diesel produces 22.4lbs of CO23. That means per season Baker emits (22.4lbs * 162,288gal / 2,000lbs/ton) 1,817 tons of CO2.
Uh okay, but is that a lot? The EPA estimates the average passenger vehicle emits 4.94 tons per year4. That means Baker’s chairlift emissions are equal to 367 passenger cars’ yearly emissions. For reference, that’s roughly equal to the capacity of the back parking lot at Heather Meadows. Given that there are around 5.5 million gas powered vehicles registered in Washington5, no, I wouldn’t say 367 is a material number in terms of contribution to state-wide emissions.
Keep in mind that the above calculations are an estimate only and depend considerably on two key assumptions: the specific fuel consumption and load factor of the engine. If the engines are more efficient or run at an average lower load factor then the actual emissions number would be lower, or vice versa if higher.
Overall though, this is less than I thought it would be when I started this estimation. There are some key emissions missing from the estimate though. Namely the snowcats for grooming, but also snowmobiles as well as any trucking of materials up the mountain, which I’ll touch on later. Regardless, “it’s less than I thought” is not zero. And everyone thinking my emissions are only a tiny fraction of a percent is not what is going to get us to zero emissions. So let’s take a look at what it would take to electrify Baker anyway.
Electrification feasibility
It’s worth stating up front that electrifying Baker is a huge undertaking and one that is not going to be cost effective, especially for such a small ski area. It would also involve disruptive construction and logging through miles of a national forest. However, this is exactly the type of project that we need to start taking seriously if emissions targets are to be met.
As a short digression, I write the above because all the renewable energy projects in the world won’t help us if we don’t have a way to transmit the power they generate to where it’s actually needed. While recent federal legislation has poured investment money into a plethora of renewable projects one of my biggest worries is that we’ll fail to sufficiently build the needed renewable infrastructure because of 1. the red tape around actually getting these projects built and 2. the ability to construct transmission lines to move power around the grid to where it’s needed. Transmission lines in particular are exceedingly difficult to build because by definition they cover long distances and touch hundreds or thousands of land owners along their routes. Each land owner with the ability to slow down or stop a project. In short, America needs a new environmentalism, one that wholeheartedly supports infrastructure projects being built in a reasonable and cost effective time frame. As The Economist puts it, preventing clean-energy projects like this is no way to save the planet, and by extension, ourselves. Electrifying Baker is a perfect example of this: it’s expensive and would be a permitting nightmare, yet at some point, it must be done.
That said, let’s run some numbers on what it would take to get power lines to Baker and then consider the overall economics of it and if there’s any alternatives, such as offsetting emissions some other way.
There are three key questions that we need to answer to generate this estimate:
- How far from Baker is the nearest grid connection?
- How much electric capacity is needed?
- How much would X capacity at Y miles cost to install?
Starting off at the top, Baker is marginally closer to the electrical grid than you may think. Naturally one would assume the nearest grid connection is in Glacier. That’s mostly true, but power lines run up the valley another five miles past Glacier due to the Nooksack Hydroelectric Plant between the Church Mountain forest road and Excelsior Pass trailhead. At 2.5MW this isn’t a large power plant (about equal to a single wind turbine in terms of output), but the lines running here are 55kV, which as I’ll get into below, is great for this case.
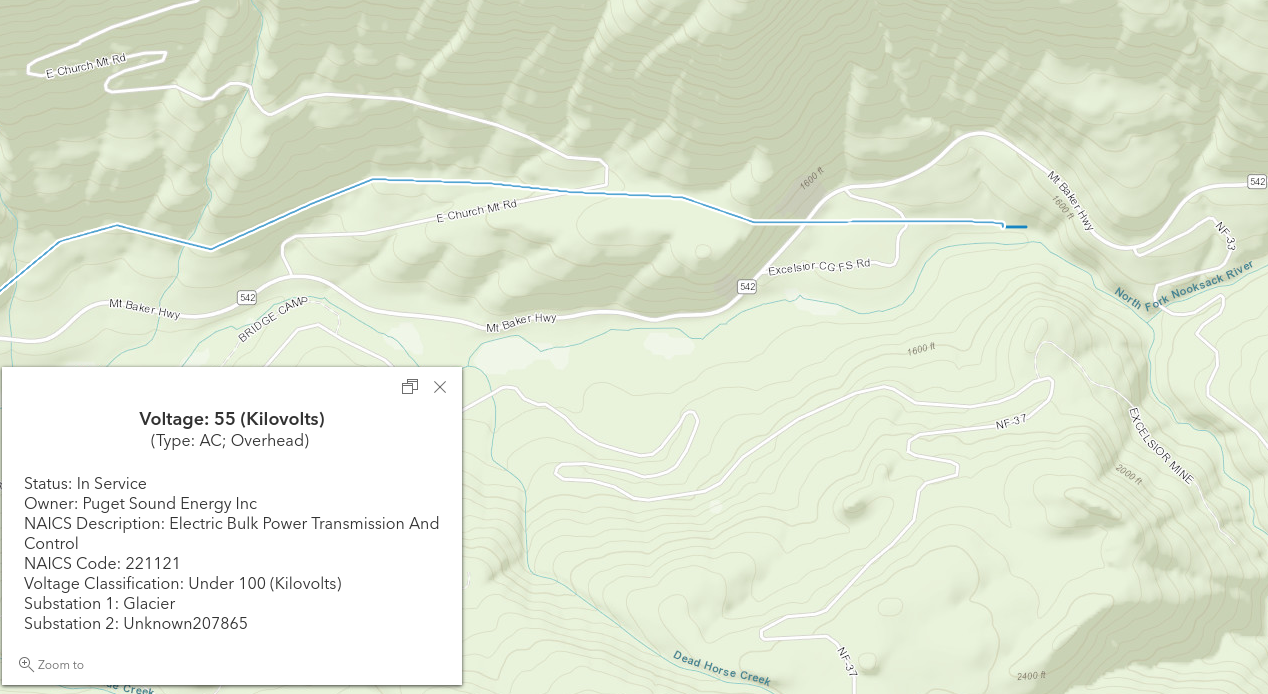
Map source: U.S. Electric Power Transmission Lines
Assuming it’s possible to extend the power lines here and following a path that closely parallels Route 542, that would mean it’s just about 10 miles to the Raven Hut base area. Ideally you would also need branches to White Salmon, Heather Meadows, and Chair 8 to get everything connected, but I’m going with only Raven Hut here for simplicity and since that’s the most bang for the buck in terms of three out of seven lifts being located there. The most direct line would be ~8 miles, but this 1. crosses over Mt. Herman and 2. would be cutting through a wilderness area so that’s a no-go.
The second question is how much electric capacity is needed to run Baker as the capacity will drive a large portion of the costs. We could do an estimate for approximately how much electric Baker would need if all the lifts were electric and the lodges were included too, but at the end of the day what we’re interested in is how much capacity do these proposed power lines need to have?
In order to get an idea of that we can simply look at other ski areas in the region which are connected to the grid already. Crystal Mountain is a great example here. Puget Sound Energy maintains a buried 34kV line from Greenwater to the Crystal Mountain Blvd. turnoff and then an overhead line to the base area.
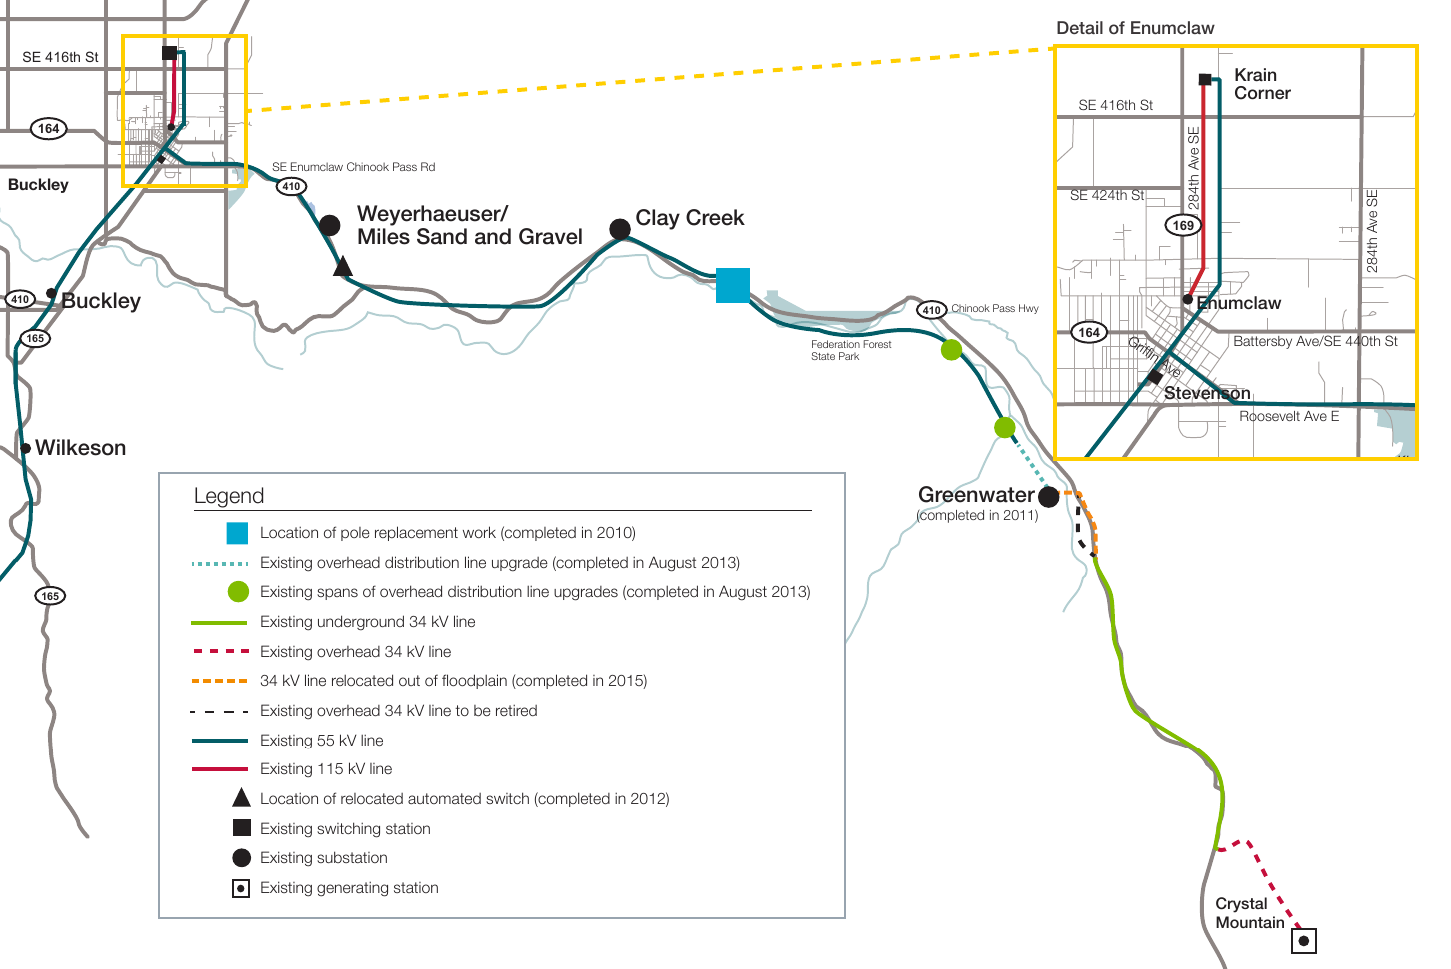
Additionally, Crystal also has a small, on-site power generation facility operated by Puget Sound Energy. At 2.5MW it’s not huge and appears to also be diesel generators that only run infrequently in the winter. I’m not sure if this supplemental power or backup power to keep the lights on in the event of an outage. But the lines coming out of it and terminating at the base area are also 34kV. If 34kV is sufficient for Crystal then surely it would be sufficient for Baker as well.
For reference, 34kV lines are fairly small as far as high-voltage lines go. These aren’t the massive steel structures you may think of when hearing “high-voltage transmission lines” (like those that run through the backside of Stevens Pass). To the contrary, 34kV lines have wooden poles and look quite similar to the distribution lines in residential neighborhoods as shown in the diagram below. In terms of effect on the scenery along Route 542, these would be well hidden by the trees. After all, have you noticed the existing 55kV lines leading up to the Nooksack Hydro Plant? Probably not.
![]()
It’s worth mentioning here too that relying on overhead power lines through a forest, in the winter, is not exactly a great idea due to frequency of outages during storms. Baker would need some type of on-site backup system in place which would increase costs further, but we’ll ignore that here, again, for the sake of simplicity (alternatively the existing diesel generators could be used and even electric lifts will have a backup diesel engine to evacuate riders in case of power outages or if the electric engine fails). Buried lines would be ideal, but they are far more expensive than overhead lines so for the sake of making this estimate remotely economically feasible only overhead lines are considered.
Given how custom and variable each transmission line project is, it’s difficult to find numbers on what these projects typically cost. The cost would vary greatly depending on location-specific factors. That said, I did find one source from the Public Service Commission of Wisconsin that claimed $285,000 for an overhead 69kV line.6 This was in 2011 so inflation adjusted that’s $387,000/mile. It’s also worth noting that Wisconsin is fairly flat, at least compared to the Cascades. So even though this figure is for a 69kV line when we’re considering 34kV lines, I would believe the challenges the terrain around Baker provides more than makes up the price difference between a 34kV line and a 69kV one.
Overall then, at 10 miles and $387,000/mile we’d be looking at somewhere around $3.87M to get power lines to Baker. There are more costs than just the lines though. Some type of substation would be needed to step down the voltage from 34kV to a voltage usable for the lodges and chairlift motors. And you’d also need to run electrical within Baker to reach White Salmon, Heather Meadows, and Chair 8. Not to mention all of the chairlifts (sans Chair 7) would need to actually be converted from diesel to electric as well. Accordingly, $3.87M should be considered an absolute floor on cost.
Is it worth it?
So then is it worth it purely from a financial point of view? Actually, maybe! If Baker is really using ~162k gallons of diesel each year then assuming they’re using dyed diesel (gas tax exempt for off-road use) then it’s likely around $4/gal with prices as of this writing which is around $648k/yr in fuel costs, not counting the costs to truck it up to the mountain. That would mean a breakeven period of just over five years from investing in power lines. However, grid electricity isn’t free either so in reality it would be longer based on the electric costs. In reality, I’d believe that the true cost of running electric lines to Baker would be considerably higher and thus the breakeven period all costs considered could be a decade or more. Is that cost effective then? Eh, no, probably not, but at least it’s a somewhat reasonable timeframe for a return on investment rather than something absurd like 100+ years.
If we’re looking at costs from the lens of emissions reductions, then maybe some government loan or grant could help reduce costs, but I’m purely speculating on that. This is the type of electrification project that likely would not be feasible without government help. On the other hand, there may be other ways to offset emissions. As arguably ineffective and borderline scammy as they are, carbon offsets for all of Baker’s 1,817 tons of CO2 would cost about $300k/yr.7 Or maybe in the future direct air capture will become commercially viable and it would be even cheaper to simply pay to scrub that CO2 directly from the atmosphere. We’re verging well into the realm of speculation here though.
However, there is one other factor to consider with this. Putting up power lines requires cleared land and when that land is existing forest it involves cutting down trees; trees that are otherwise absorbing CO2. We need to calculate and subtract the amount of CO2 those trees absorb each year from the amount Baker emits to get an accurate picture of the net emissions benefit to this type of a project.
Let’s do some more back of the envelope on this. The right of way width for 69kV lines is around 80ft.8 We’re talking about 34kV lines, and not all 80ft would necessarily need to be cleared of trees, but this makes for a decent upper bound to estimate off of. So then that’s 80ft * 10 miles = 4,224,000sqft = 96.96 acres.
According to the Washington DNR, the Mt. Baker-Snoqualmie National Forest sequesters 1.83 tons of CO2 per acre per year.9 Given the 96.96 acres figure above, that means we’d lose 177 tons of CO2 sequestration (in reality a bit less since the land wouldn’t be 100% clear of all vegetation). If Baker emits 1,817 tons/yr then the overall net effect is still ~1,640 tons fewer than continuing to burn diesel.
What about hydrogen?
Baker occupies an interesting area in terms of off-grid energy use. Its energy needs are large enough that we’d like to eliminate the emissions produced fulfilling them with diesel creates, but small enough that it’s not necessarily worth it to run power lines to such a remote location (and also much smaller than something like NuScale is targeting for off-grid use with their SMRs). Given this I believe there’s one other option at least worth taking a look at: hydrogen.
Before getting into it though, hydrogen has its problems as an energy source. It’s expensive to produce, difficult to transport in sufficient quantities, expensive to store, and most current hydrogen production comes from natural gas (so-called “blue hydrogen”) so it’s not doing all that much in the “reduce emissions” department, but, hey, it’s an incremental improvement at least.
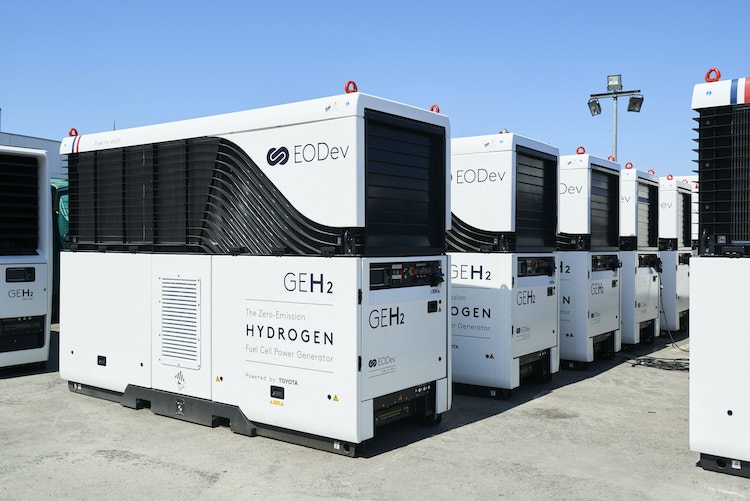
Despite the problems, the options for hydrogen electricity generation are growing as the market for it begins to emerge. For example, Caterpillar has generators that run on a blend of natural gas and hydrogen and EODev has a 100% hydrogen generator capable of outputting 110kVA. This is a new enough area that it’s difficult to get numbers on these generators, install costs, fuel sourcing/pricing, and transportation to the mountain in order to do an approximate feasibility analysis. In lieu of that, we’ll have to leave it as “it’s an option on the table,” potentially a quite good one given a few more years of development of hydrogen supply chains.
Also, one notable benefit to on-site generation is its reliability. As mentioned above, overhead power lines carry the risk of outages during storms from falling trees/branches. There’s also the ongoing maintenance and inspection costs associated with miles of lines. That all increases costs even further from the numbers calculated earlier, plus you’d likely need an on-site backup system present anyway. With on-site generation this is simply having spare capacity built-in. Even though on-site generation has the ongoing fuel transportation costs associated with it the overall maintenance costs should be markedly lower and reliability considerably higher.
This is also a good place to consider the use of on-mountain snowcats for grooming and snowmobiles for operations & ski patrol. A small ski area like Baker makes an excellent candidate for electric snowmobiles and electric, or possibly hydrogen powered snowcats. Since these vehicles operate in a fixed area range is not a big concern in that the snowmobiles could be plugged in between use and for grooming, if hydrogen powered, could make refueling trips down the mountain without too much trouble as needed. This is yet another expensive investment, but one that is likely to become more of an option in the not-too-distant future. More analysis is needed here.
Conclusions
Alright, where are we left after all of this? For me, the bottom-line takeaways are:
- Baker likely emits somewhere around 1,817 tons of CO2 per year, or the equivalent of ~367 passenger cars. This is somewhat less than I was expecting when starting this project.
- If Baker were to run electric lines to its base area it would result in a net decrease somewhere around 1,640 tons of CO2 per year. The cost for doing this would be north of $3.87M, likely marginally or considerably higher.
Given those findings, yes, Baker should, ideally, be connected to the power grid, but doing so remains not cost effective. If the funding problem for such a project were solved, then yes, by all means, it should be done. Short of that, however, Baker’s current projects to convert as many lifts as possible to electric powered by diesel generators I believe is the right action to be taking at the present time. This is more efficient financially and ecologically, makes the lifts more reliable, and lays the groundwork for a hopefully future grid-connection electrification project.
On the other hand, it’s difficult to know the future technological, logistical, and economical viability of hydrogen generators but in reality that may prove to be the most realistic option if the mountain is already electrified and the switch becomes as simple as swapping out diesel generators for hydrogen ones. Using the time between now and when that market will hopefully mature to lay the groundwork for such a project by converting the mountain from discrete diesel engines in various locations to centralized diesel generators would appear to be the best move for the time being.
Overall, while it may be disheartening to continue to watch the black chairlist exhaust obscure that view of Shuskan on those clear winter mornings for the foreseeable future, I look forward to the day when we’re riding on electric chairlifts ultimately powered either from clean wind/solar/hydro/nuclear grid power or on-site hydrogen.
Sources
-
Klanfar, Mario & Korman, Tomislav & Kujundžić, Trpimir. (2016). Fuel consumption and engine load factors of equipment in quarrying of crushed stone. Tehnicki Vjesnik. 23. 163-169. 10.17559/TV-20141027115647. ↩
-
Saber, H. A., Al-Barwari, R. R. I., & Talabany, Z. J. (2013). Effect of ambient air temperature on specific fuel consumption of naturally aspirated diesel engine. Journal of science and engineering, 1(1), 1-7. ↩
-
Carbon Dioxide Emissions Coefficients, U.S. Energy Information Administration ↩
-
Greenhouse Gases Equivalencies Calculator - Calculations and References, U.S. Environmental Protection Agency ↩
-
Vehicle Registration Counts by State, U.S. Department of Energy ↩
-
Underground Electric Transmission Lines, Public Service Commission of Wisconsin. (2011) ↩
-
Transmission Cost Estimation Guide, MISO Energy ↩
-
Washington Forest Ecosystem Carbon Inventory: 2002-2016, Washington Department of Natural Resources. ↩