I often have conversations on the chairlift or the skin track that involve how the Cascades don’t get as much as snow as they used to. It has been said that the 1950s/1960s were the golden age of skiing in the PNW and our ski seasons now are shorter, with less snow, more frequent rain, and that the future is bleak. Putting aside the chairlift hearsay I wanted to know what the data said about the accuracy of that sentiment. Specifically, I set out to answer the following questions:
- Are the Cascades getting less snow than they used to?
- Are our ski seasons becoming shorter?
- How has climate change affected our ski areas in Washington?
- And most importantly, what does the future hold?
Surprisingly, the answer to those first two questions is… eh, not really. We’re more or less getting the same amount of snow currently as in the 20th century; arguably more in some cases! Which begs the question, are we still in the golden age of PNW skiing? Quite possibly, but if so, for how much longer?
However, there are some BIG caveats to that statement. Unfortunately, the full answer to these questions is not a short one. As for the latter two questions, well, the future is not looking good without adaptions but it may not be as bad as you think. Here I explore what over 100 years of snowpack and snowfall data in the Cascades tells us, how broader regional cycles affect our weather, what actual peer reviewed studies have concluded, and what this means for skiing in the Cascades in the near and foreseeable future.
Disclaimer & Scope of Research
Before getting into any numbers though, a note: I am not a climatologist or have really any background or credibility on these subjects aside from spending a borderline unhealthy amount of time pouring over historical snowpack data and contemporary studies on the subject. Sources will be provided where needed but none of the material here should be considered an authoritative source. Any random person can put some nice looking graphs on a blog; doing your own verification is critical. Please email me (see header) with any corrections or oversights you may find.
Furthermore, the topic of snowpack decline in the western US is massively complex with more variables than I could possibly account for. To that end, everything here is presented through an extremely narrow lens: snow and ski conditions at specific locations in the Cascades. Snowpack amounts for critical applications such as agriculture is a topic best left to the professionals. Snowpack loss in other locations/elevations than are used for skiing is an incredibly large problem with far reaching ramifications but is outside the scope of this writing.
Data & Methods
With that said, our journey starts with finding a source of historical snowpack data. The USDA’s SNOTEL monitoring system provides all the data we could ever ask for starting from the mid 1960s but really in earnest around Washington from the 1980s. Additionally, here in Washington we have NWAC’s monitoring stations at ski areas themselves but only for the past decade or so. For reasons I’ll get into later, what I really wanted was to get snowpack data reaching back into the early 1900s, or at least prior to the 1950s. Data going back this far and with a consistent period of record is difficult to find.
Before the SNOTEL network was established most snowpack data we have came from NOAA’s Cooperative Observer Program (COOP) where volunteers would manually record daily (or weekly/monthly) weather data. For example, we can view the daily weather at Paradise in February of 1926. Thankfully these records were digitized in the 2000s making analysis of them far easier. The problem with manual collection of this data though being that much of the data is missing and only available for certain years at a variety of locations. Frustratingly, a good amount of this data collection has been stopped due to the automation provided by the SNOTEL sites. Limiting our options further is that we want to consider specific elevations here that are in the range of where our ski areas currently reside at. Fortunately, there are a few long running COOP programs at the elevations we care about for skiing in the Cascades with nearly complete datasets. For other locations we can piece together historical COOP observations with more modern SNOTEL and NWAC data to compare trends over time.
By gathering data from all of these sources and graphing it we’re able to see how our snowdepth, snowfall, and average temperatures have changed over the past century. By exporting this data and writing a small Ruby program to process all of it into a single, graphable format we can analyze the trends in our snowpack over the years. For those so inclined, the full datasets and code used to parse the datasets to generate the graphs below is available on GitHub.
See sources for links to each station used here.
Peak Snowdepth
Starting without any context, let’s take a look at historical peak snowdepth. Locations around Rainier have the most complete data given the park’s long history. There are periods of record stretching all the way back to 1915. Namely, we have three excellent sources of data at different elevations:
- Paradise at 5,425ft
- Longmire at 2,762ft
- Ohanapecosh at 1,949ft
The below graphs show the yearly peak snowdepth for these locations (peak snowdepth being the maximum snowpack achieved at any point in a snow season, August thru the following August).
The trendlines on these graphs are a simple linear fit but some trends immediately jump out. The snowdepth at Paradise has remained essentially steady over the period of record. There is an almost imperceptible negative slope but it is essentially constant at 200in. However, Longmire and Ohanapecosh show significant downward trends. This isn’t exactly unexpected given their relatively low elevations. Low elevations will be the first & most affected with decreased snowpack as global temperatures increase. At Longmire it’s roughly a 20% decline.
What is surprising to me, however, is the lack of noticeable decline at Paradise. Most of our ski areas in Washington are in that 4,000ft - 6,000ft elevation band which Paradise sits in. For skiing purposes, our snowpack has historically not changed all that much. That’s just one data point, but this is backed up by similar data at Stevens Pass (~4,000ft), Mt. Baker (Heather Meadows, ~4,200ft), and Snoqualmie Pass (~3,000ft):
Here we can see that there are again some small negative trends, Snoqualmie being the largest and also at the lowest elevation of the three, but overall the snowpack depth is not all that much different over the years. For the purposes of skiing, we’d hardly notice it.
But wait, Snoqualmie is at 3,000ft and Longmire is at 2,700ft. Why does Longmire should such a large decline but Snoqualmie only shows a modest decline? Is 300ft really that much of a difference? It’s worth taking a moment to throw another variable in the mix. Mountains are complex environments. Taking the data from one location, such as Longmire, and applying to everywhere at the same elevation band in a mountain range is a bad comparison. Local effects exist that can cause considerably different climates within close geographical locations. In the case of Snoqualmie, it is, of course, a mountain pass. Its low elevation actually works to its benefit for the purposes of snowfall. In the winter, the air in eastern Washington is much colder than the air in western Washington. It is not easy for the cold air east of the Cascades to make its way to the west slopes of the Cascades. The low elevation of Snoqualmie Pass’s connection to that cold air in eastern Washington allows it to stay colder than other parts of the Cascades at similar elevations which do not have that reservoir of cold air to tap into.[2] With that in mind, we can understand how Longmire at 2,700ft, which has no connection to the east, shows more snowpack decline than Snoqualmie does at just 300ft higher.
Ski Season Length
Okay, so our snowpack isn’t seemingly declining in any significant way, at least in the locations we care most about for skiing. But what about the length of ski season? It’s shorter, right? Again, the answer is: not really, no.
Consider the graph of daily snowdepth at Paradise:
Filter by decade:
And also for Heather Meadows (Mt. Baker):
Filter by decade:
These graphs are colored such that if there was a trend of shorter seasons we would see warm colors (red, orange, yellow) shifted to the right and cool colors (green, blue, purple) shifted towards the left. This is just an eyeball fit but there’s no clear discernible trend that would imply our ski seasons are getting shorter. The meltout dates appear to be stable, at least above 4,000ft. And as we’ll get into later, studies have shown have this is indeed the case as well.
Meanwhile, I have read contradictory takes on this stating that the Cascades have lost 28 days of snow season from the 1980s to today. This does not seem to be supported by the data at the elevations used for skiing in the Cascades. In fact, as I’ll get to below, when we’re considering strictly the period from the 1980s to today, we’re seeing more snow! I contacted the author of the linked to NY Times article asking for a citation to that claimed 28 day reduction figure and received no response. I was unable to find the derivation of that number from the listed source in the article.
So, for the most part, our snowpack for skiing isn’t declining and our ski seasons are as long as they used to be. We’re good then, right? Unfortunately, no.
Max Snowfall & Average Temperature
This is where we need to look at a few more graphs and bring snowfall and temperature into the picture.
A note on snowfall: It’s extremely difficult to get consistent snowfall data prior to the SNOTEL sites. Unlike snowpack where an observer need only measure the current snowpack on a daily, weekly, or monthly basis, snowfall must be recorded daily otherwise it is lost as the fallen snow consolidates into the existing snowpack and new snow comes in. Paradise and Longmire are the only two locations that I know of in the Cascades that have a complete enough and long enough period of record to be useful for analyzing snowfall trends prior to the 1960s.
Curiously, if we look at the amount of snowfall Paradise has received in a given year we can see that there is an upward trend! But this odd because as shown above with the graph of snowdepth there’s a flat or hardly perceptible downward trend. If there is more snow falling then why is the snowpack depth remaining constant? It should be increasing as well, no? Well if we consider the average temperatures this where the worrying trends begin to emerge.
By graphing the average winter temperature (December - March) of each year we see there is a clear upward trend. For Paradise, this is still below freezing so the precipitation continues to fall primarily as snow but the closer that average winter temperature gets to freezing the more rain will fall and the snowpack depth will begin to decrease as it has done at lower elevations.
If we look at the average daily temperature we can see this in more detail:
Filter by decade:
Filter by decade:
At both Paradise and Longmire we can see that the average daily temperature remains in a fairly constant band year-round. However, the warm colors representing the years from the early 20th century are clearly more stable. The cool colors representing the late 20th century and 21st century show less regularity. There are more irregularly hot days and cold days. For Longmire, December - February is increasingly irregular.
Therefore, the data here appears to conclude that while the overall snowpack at high elevation locations (>4,000ft) is seemingly stable and while there is actually increasing snowfall in some cases, the average temperatures are warming. Eventually when those average temperatures get to freezing we will begin to see the snowpack decline at our ski areas as well.
Why is this happening?
The answer to these trends may be so obvious that it would go without saying: climate change caused by human carbon emissions. That is certainly a factor, and a large one at that, but it is not the only factor.
Most skiers in the PNW are familiar with ENSO or the El Niño Southern Oscillation. At the start of each season we hear rumors of if it will be an El Niño year or a La Niña year and what implications that will have for our snowfall. Indeed, ENSO provides some natural variability on a year to year basis that can affect our snowpack there is another natural cycle to consider as well, one that arguably has much greater affects than ENSO.
The Pacific Decadal Oscillation, or PDO, is a mutli-decade oscillation in temperature of the North Pacific. Its warm and cool phases can last for up to 30 years and have far reaching effects on our winter weather in the Cascades. While the ENSO primarily affects the Pacific near the equator, the PDO primarily acts on the northern Pacific.
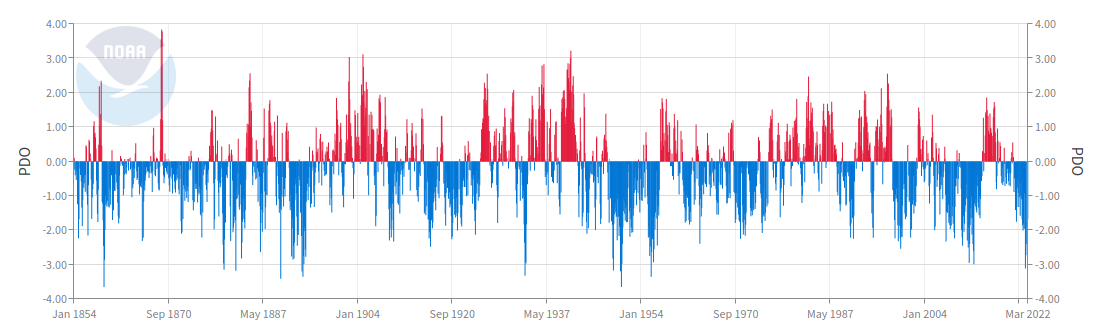
PDO graph taken from https://www.ncdc.noaa.gov/teleconnections/pdo
I alluded earlier to wanting to find consistent data starting in the early 1900s instead of the 1960s - 1970s when SNOTEL sites started to come online. The reason for this is that we can break the previous century up into a few distinct PDO cycles:
- Negative: 1909 - 1924
- Positive: 1925 - 1944
- Negative: 1945 - 1976
- Positive: 1977 - 1998
- Negative: 1999 - 2014
- Positive: 2015 - 2017
- Negative: 2018 - Present
The problem with starting in the extremely negative cycle of 1945 - 1976 is that it creates a selection bias in the data by starting from what is the recent high point of PNW snowfall. Cross reference these periods with the graphs above. We can see that, for example, the 1930s were a poor decade for snowfall in the Cascades, just as bad or worse than the 1970s and 1980s.
This is not to say that the PDO is directly correlated with good and bad snow years and we can ignore all other factors. After all, correlation does not equal causation. But rather the PDO is one more variable to account for, albeit a fairly important one. Any snowpack analysis that does not accurately account for it is missing a heavy influence on our snowpack.
Another point to consider is that the northern Pacific is warming slower than other parts of our oceans. It’s no secret that the Cascades are one of the snowiest places on Earth due to the air masses that travel for days over the Pacific picking up heavy amounts of moisture. This air is then lifted above the Cascades causing them to cool, condense, and release that moisture as massive dumps of snow and the sickest of pow days. The temperature variability of the ocean, specifically the northern Pacific, is critical to determining how much of that precipitation falls as snow.
Interestingly, the northern Pacific is one of the slowest warming regions of ocean (see figure below). That results in the driver of most of our weather is warming at a slow rate leading to more climate stability than in other parts of the world (in the winter at least, summer trends are out of scope of this analysis).
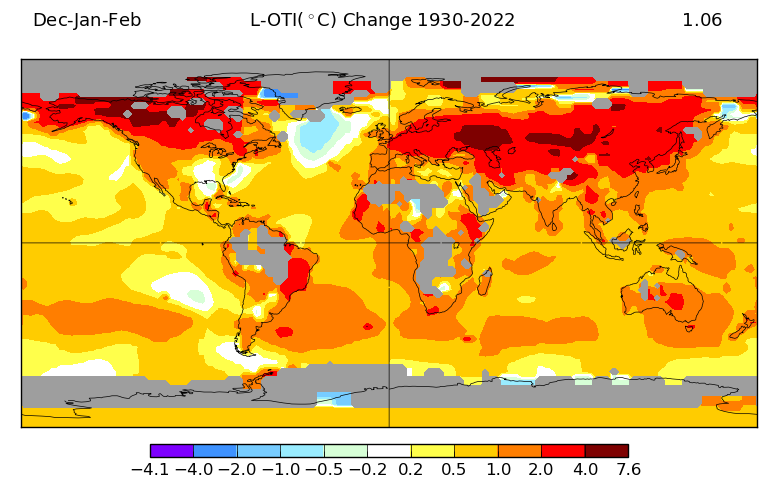
Surface temperature map generated from https://data.giss.nasa.gov/gistemp/maps
What do the studies say?
It’s here that I feel it worth to digress for a bit and reference actual peer reviewed studies that have been published on the topic of snowpack declines in the Cascades. In my research for this blog post one study above all others kept coming up as references for other studies and publications. That is the 2008 Mote study, Has spring snowpack decline in the Washington Cascades?[3]. Consider a few points from this paper:
- The authors conclude that as of 2006 there was a 15-35% reduction in snow water equivalent (SWE) in the Cascades.
- They note that the bulk of this loss was from low elevation and high elevations decline less or in some cases increased.
-
Our best estimates of 1 April snow water equivalent (SWE) in the Cascade Mountains of Washington State indicate a substantial (roughly 15–35%) decline from mid-century to 2006, with larger declines at low elevations and smaller declines or increases at high elevations.
- The methodology used is streamflow data to estimate SWE throughout the Cascades.
- Given the limited number of snow courses locations this makes sense. The goal of this study is to analyze the entire Cascades range instead of a few select ski locations that we are most interested in here. When your goal is to know how much SWE exists overall it makes sense to use streamflow data given how it captures snowmelt from entire regions of the mountains than one point location. However, this does introduce some bias in that a hydrology model may not be the ideal method for assessing snowpack for the purposes of skiing in that the snowpack from the year only reflects in the data as it melts in the spring.
- Most curiously, the authors decide to start their period of record in 1944, exactly at the start of the largest negative PDO cycle of the past century.
-
With the goal of characterizing the variability over as long a time as possible without too severely underemphasizing low elevations, we primarily use the time series starting in 1944. From Table 3 it is clear that this is a fairly conservative estimate of the trends; combined with our conservative choice regarding area-weighting, the computed trends here are likely on the small side.
- Whether or not this is a “fairly conservative estimate of the trends” is up for debate; I’d argue it is not.
-
As a result, I’m not a big fan of using the Mote analysis as a harbinger of future ski seasons in Washington. In fact, there are similar dissenting views to the Mote analysis. In 2009 another study was published; the Stoelinga A New Look at Snowpack Trends in the Cascades Mountains study[4]. Some points of interest from this study:
- The authors specifically performed their analysis starting in 1930, well before the heavily negative PDO trend starting in 1945.
- They found that snowpack decreased 23% during the 1930 - 2007 period. However, between 1976 - 2007 snowpack actually increased 19%.
- When looking at the 1950 - 1997 period a whooping 48% loss occurred but that 80% of this decline is attributed to the PDO cycle.
- End of season melt out dates are 5 days earlier from 1930 (but this was found to be statistically insignificant).
- The observed loss is primarily due not to decreased precipitation but rather increased temperatures.
- Overall, when controlling for natural variability it appears there is a 2% snowpack decline per decade from 1930 - 2007 yielding a 16% loss due to, most likely, the authors conclude human carbon emissions.
- For future decades, this will accelerate to a 2.3% loss per decade and that for every 1.1°C of warming, 11% of snowpack is lost.
Given that the Stoelinga study looked at up to 2007 we can use those predictions to extrapolate to the current year, 2022. With another 15 years behind us since then and assuming the higher 2.3% decline per decade figure, that would result in an additional 3.45% bringing the total decline from 1930 to 19.45%.
But wait, up above the graphs of Paradise and other ski area locations showed a mostly flat trend. That’s not a 20% decrease so what gives? Well, we have to keep in mind that the studies above were estimating the total amount of snowpack in the Cascades. According to Mote (2008), approximately half of the snowpack in the Cascades on April 1st lies at elevations below 4,000ft. This makes sense since there’s simply less land at high elevations to hold snow. Of the locations below that elevation, for example Longmire, that calculated ~20% decline since 1930 is shockingly accurate when compared to the observations in the graphs above of the COOP data. For locations above 4,000ft the decline is much less pronounced due to the temperatures remaining below freezing primarily.
Is a rapid snowpack decline in the future?
After all that though, one thing still bothered me. If we’re currently in a negative PDO cycle close in magnitude to the 1950s-1960s negative cycle why are we not seeing the same level of snowfall? The snowpack at these higher elevations appears to be holding constant. Does that mean that the negative PDO cycle and other natural variability is masking the amount of snowpack decline that we would otherwise be experiencing? When the these natural cycles flip the opposite direction are we in for a period of rapid snowpack decline?
A 2018 study, Natural Variability Has Slowed the Decline in Western U.S. Snowpack Since the 1980s[5] argues this is the case and that we are likely headed towards periods of rapid decline in snowpack in the coming decades.
What exactly does “rapid decline” mean though? Are we talking some bad snow years or a complete collapse of the ski industry in Washington as ski areas become economically nonviable? There are two years in particular that we can use for comparisons.
- First, 1977 was the year when the negative PDO cycle from 1945 flipped the other direction. The 1976/1977 season was so dry that the North Cascades Highway remained open to traffic throughout the winter.[6] It showed how quickly the overall snowpack trends can flip the opposite direction.
- In recent memory though, we suffered through the 2015 season. Snowfall was so abnormally low that year that Snoqualmie had to temporarily close… in mid-February.[7] Multiple years like that will almost certainly cause a ski area to fold entirely.
Does that mean 2015 is a preview of our future winters? A 2016 study, Testing the recent snow drought as an analog for climate warming sensitivity of Cascades snowpacks[8] asked that exact question. The authors state that the air temperature anomalies that year were somewhere between 2°C and 4°C above normal. While the authors did not determine that 2015 was an ideal analog for the future of snowpack in the Cascades, they did determine that peak snow water equivalent (SWE) was well correlated even if the date of peak SWE was not. The former being of more interest to us skiers than the latter is so in some ways it is a preview of PNW skiing in a world with more than +2°C of warming.
The future viability of skiing in the Cascades then becomes a question of where will the overall global temperature increase end up being? This blog post being an extremely long winded way of getting to what is such an obvious question. From the aforementioned study and first hand observations from 2015 we know that a 2-4°C scenario is likely not compatible with commercial ski area viability. But frankly, in that scenario we will have much larger problems to deal with than worrying about getting some good skiing in. What this number will end up being is a topic far beyond the scope of this blog. So let’s assume that humanity gets its collective act together and limits warming to 2°C per the Paris Agreement because if we don’t this entire topic is moot.
What does skiing in the Cascades look like in a world marching towards 2°C then? A 2006 study, Mapping “At Risk” Snow in the Pacific Northwest[9] shows us just that. The authors calculate the probability that western Washington’s ski areas will have a “warm winter” defined as an average winter temperature of greater than -2°C (just below freezing).
Probability of average winter temperature above:
| Ski area | -2°C | -1.5°C | -1°C | -0.5°C | 0°C |
|---|---|---|---|---|---|
| Mt. Baker | 0.33 | 0.13 | 0.03 | 0.03 | 0.03 |
| Mission Ridge | 0.37 | 0.27 | 0.17 | 0.07 | 0.07 |
| Crystal Mountain | 0.47 | 0.27 | 0.13 | 0.03 | 0.00 |
| White Pass | 0.47 | 0.30 | 0.20 | 0.07 | 0.00 |
| The Summit at Snoqualmie | 0.57 | 0.53 | 0.43 | 0.33 | 0.27 |
| Stevens Pass | 0.37 | 0.27 | 0.10 | 0.03 | 0.03 |
The table above, taken from Nolin & Daly (2006), shows the probability that the average winter temperature at a ski area will be above -2°C to 0°C. This means that, assuming a 2°C climate warming there is a 57% probability of the average winter temperature being above freezing at Snoqualmie. Basically, this would mean a year with more rain than snow. Granted, the authors admit there is some uncertainty in these numbers given the grid cell resolution of their model and that it does not account for variables such as individual cold storms occurring within a warm winter. For example, it’s interesting that Mt. Baker at a lower elevation than Crystal has a lower probability of rain, but, of course, elevation alone does not determine mountain weather. However, these give us a rough estimate of the year-to-year odds of having sufficient snowpack. Whether these ski areas can remain economically viable with those odds is another topic. The first ski area to face this test will be Snoqualmie.
Conclusions
We can now summarize the overall trend of snowpack depth in the Cascades at the elevations used for skiing into one point:
The Cascades have experienced a ~20% decline of snowpack from 1930 - 2022 at a rate of 2% per decade. However, this is primarily limited to low elevations below 4,000ft and is due to increased temperatures rather than decreased precipitation. At high elevations (>4,000ft) the snowpack has not seen these large declines for now but increasing global temperatures and natural variability will begin to, potentially rapidly, affect these elevations in the coming decades.
So, what does this mean for the future of skiing in Washington? The good news is that in the short term, probably not a whole lot. Most of our ski areas will continue to receive normal levels of snow as most of our ski area base elevations are located above 4,000ft. These conditions will not last forever though. Most unfortunately human carbon emissions will continue at unacceptably high levels for the foreseeable future and eventually the PDO will shift positive again possibly kicking off a rapid decline in snowpack.
It has been said that the 1950s & 1960s were the golden age of skiing in the PNW due to the abundant snowfall, but the era we live now is not much different. Given what we know is coming, in the not too distant future we and our descendants may be looking back on all of 1950 - 2020/2030s as that golden age instead. For the time being, we mustn’t take it granted; we should consider ourselves fortunate to be living through an era of still exceptionally high snowfall and excellent skiing.
On the other hand, this decline is not a forgone conclusion. We need decisive climate action to prevent the worst scenarios and adaptions to the warming that we are already experiencing so that the future generations may experience winter recreation in the Cascades just as we have been fortunate enough to have experienced. The first problematic area will be Snoqualmie Pass as it sits well below 4,000ft. There has already been an appreciable decline in snowpack there unlike at other ski areas. Given how much of the Seattle population is served by Snoqualmie, serious thought should be given for adaption measures in the coming decades. We should prepare to lose a significant amount of ski area capacity. Will there be the political will to replace this capacity elsewhere? How will we adapt winter recreation to a changing climate and what are our options to do so?
To be continued…
Sources
-
- NOAA COOP (Cooperative Observer Network). Specifically the following stations:
- https://www.ncdc.noaa.gov/cdo-web/datasets/GHCND/stations/GHCND:USC00456898/detail
- https://www.ncdc.noaa.gov/cdo-web/datasets/GHCND/stations/GHCND:USC00456894/detail
- https://www.ncdc.noaa.gov/cdo-web/datasets/GHCND/stations/GHCND:USC00456896/detail
- https://www.ncdc.noaa.gov/cdo-web/datasets/GHCND/stations/GHCND:USC00453728/detail
- https://www.ncdc.noaa.gov/cdo-web/datasets/GHCND/stations/GHCND:USC00453730/detail
- https://www.ncdc.noaa.gov/cdo-web/datasets/GHCND/stations/GHCND:USC00455128/detail
- https://www.ncdc.noaa.gov/cdo-web/datasets/GHCND/stations/GHCND:USC00455133/detail
- https://www.ncdc.noaa.gov/cdo-web/datasets/GHCND/stations/GHCND:USC00455663/detail
- https://www.ncdc.noaa.gov/cdo-web/datasets/GHCND/stations/GHCND:USC00458059/detail
- https://www.ncdc.noaa.gov/cdo-web/datasets/GHCND/stations/GHCND:USC00458089/detail
- USDA Snotel
- WRCC
- NWAC
- NOAA COOP (Cooperative Observer Network). Specifically the following stations:
- https://cliffmass.blogspot.com/2013/01/the-secret-of-snoqualmie-pass.html
- https://cig.uw.edu/publications/has-spring-snowpack-declined-in-the-washington-cascades/
- https://journals.ametsoc.org/view/journals/clim/23/10/2009jcli2911.1.xml
- https://repository.library.noaa.gov/view/noaa/21099
- https://wsdot.wa.gov/travel/roads-bridges/mountain-pass-closure-and-opening-dates
- https://komonews.com/news/local/snoqualmie-summit-waves-white-flag-temporarily-closes-11-21-2015
- https://iopscience.iop.org/article/10.1088/1748-9326/11/8/084009
- https://journals.ametsoc.org/view/journals/hydr/7/5/jhm543_1.xml
Appendix
There are a few other locations with a good history of historical data. Specifically, Mazama, Holden Village, and Stehekin. I include them below for reference but overall they show the same trends as the locations discussed in detail above. That is: essentially stable snowpack depth for the period of record dating back to the early 1900s.
Note: Despite the upwards trend with Mazama the dataset is comprised of two different locations at slightly different elevations. It’s unclear if this trend is still present when controlling for differences between the stations. Also note the large amount of overlapping years 1950 - 1976. This overlap could be used to compare differences between the stations.
Note: Holden has two different locations, the first being ~200ft higher than the second. It’s unknown how these two sites differed from one another. The trendline here may very well be flat when accounting for the elevation difference and measurement methodology. Considering only the 1962-present data a flat trendline is more the case. Because of the difference in locations I’m hesitant to include it at all but there are few stations with consistent data back to the 1930s so I felt it was worth including.